Crystal Ball in Crisis
| December 7, 2021After his epic failure predicting the New Jersey race, leading pollster Patrick Murray pronounces his craft dead
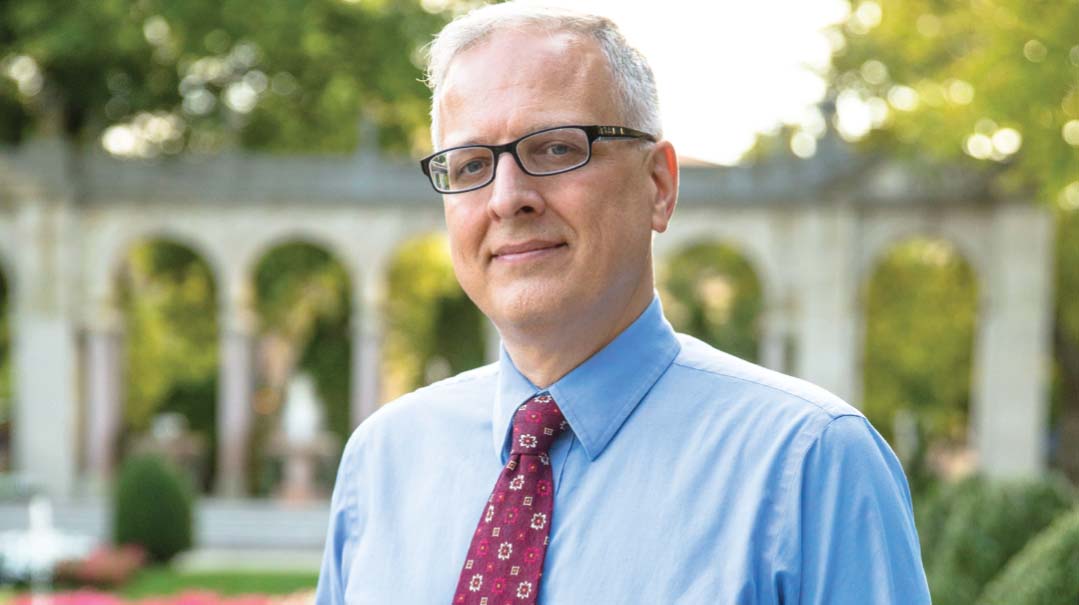
Photos: Courtesy of Monmouth University, AP images
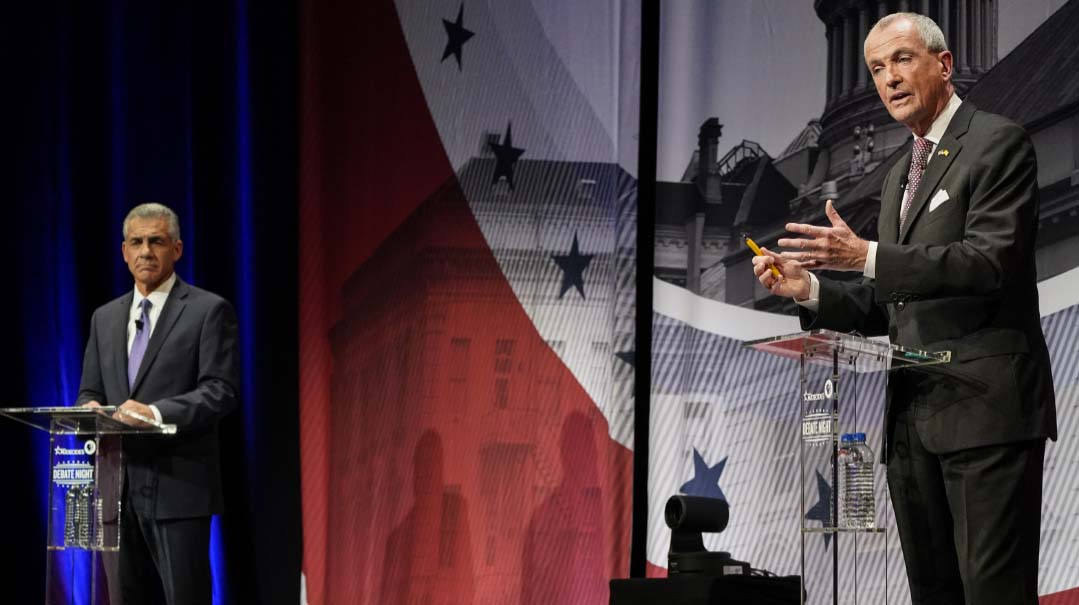
A month is an age in politics, and bar the last few bedraggled “Jack for Governor” lawn signs in Lakewood braving the winter weather, there are few outward clues to the heated campaign fought over the New Jersey governorship a few weeks ago.
The uninitiated observer would be hard-pressed to divine the fierce tones of a local political race that took on national dimensions.
But while all involved — from the freshly reelected incumbent governor Phil Murphy to the defeated challenger Jack Ciattarelli, and the politically divided Jewish communities — have moved on, there’s one man who feels he can’t.
Patrick Murray, founding director of the Monmouth University Polling Institute — considered one of the nation’s premier survey firms — admitted in a November 4 op-ed that he “blew it” on the recent New Jersey gubernatorial election.
“If you are a Republican who believes the polls cost Ciattarelli an upset victory or a Democrat who feels we lulled your base into complacency,” he wrote for NJ.com, “I hear you.”
As Politico noted about a mea culpa that made waves in the political world, “Murray didn’t announce his departure from the business, but he walked right up to the line.”
But in the days since that op-ed, the pollster has gone further, indicating to Mishpacha that his days releasing late-breaking polls were over.
Each mistaken poll “has a geometrically larger impact on undermining public trust than the previous one,” he says. And with a yawning and ever wider partisan gap in American public life, he confesses, “I think it’s a fatal sin in terms of civic responsibility right now.”
The Murphy-Ciattarelli race wasn’t expected to be close. The Garden State has long trended blue, with Democratic voter registration outstripping Republicans by more than a million. And the campaign fundamentals all pointed to an easy reelection for the Democratic incumbent, Governor Phil Murphy.
His Republican challenger, a previously unknown former state assemblyman named Jack Ciattarelli, kept insisting he was within striking distance, and campaigned tirelessly to close the gap.
But that claim fizzled when a flurry of polls came out the week before the election showing a cakewalk for Murphy, with a lead of at least eight percentage points.
The survey that got the most attention was Monmouth’s, which found Murphy winning by 11 points, 51–40. New Jersey politicos considered Monmouth the gold standard for public opinion polling; Patrick Murray’s firm had basically been accurate on gubernatorial elections going back to Democrat Jon Corzine’s 2005 victory.
So, when balloting closed on election night, and the race was too close to call, everyone was shocked. The tight margin that night had a lot to do with the way the votes were counted — the high rate of mail-in ballots, which skew heavily Democratic, were only counted in the days following.
But even now, with a much more accurate count, Murphy’s margin of victory is less than 3.5 points — more than a hairbreadth, but nowhere near the 11 points Monmouth had predicted.
Patrick Murray’s public mea culpa included a frank admission that maybe the time had come to scrap election polls. His introspective take conceded what many outside observers have been saying for a while now — that election polling is too broken to serve a positive role in the current hyper-partisan environment.
Poll Position
Controversy over the reliability of political polls is as old as the industry itself — which is to say, not very old at all.
“The argument over whether public opinion polls are good or bad for a democracy has become somewhat academic — they are obviously here to stay,” concluded a May 1948 Time magazine article about a New Jersey resident named Dr. George Horace Gallup, who had come up with a method of measuring public opinion that was seen as a novelty at the time.
Gallup, an Iowa farm boy, was described by a friend as having “wishe[d] he had invented the ruler, [but] since someone beat him to it, [he] has spent his life thinking up new ways to use it.” In this political moment, so driven by polling and the all-important public opinion, it’s hard to imagine there ever was a time before political polls, but it was that sort of world Gallup came of age in — and the world he changed forever.
While running the University of Iowa’s student newspaper, he wondered if there wasn’t a better way to figure out which parts people enjoyed and which they didn’t, aside from monitoring reader complaints. He began surveying his readers and found out (somewhat unsurprisingly) that they preferred the comics over anything else.
He decided to do his PhD thesis on that subject, landed an academic job, and ran similar surveys for more newspapers across the country — surveys that helped direct ad dollars and shape marketing campaigns.
And in 1932, he had an epiphany. “If it works for toothpaste,” he asked himself, “why not for politics?”
He spent a few years refining his sampling process, and in 1936 he famously went head-to-head with the widely respected Literary Digest presidential poll, which used postcards mailed out randomly to names on voter registration lists. Literary Digest predicted that Republican challenger Alf Landon would topple Democratic incumbent Franklin D. Roosevelt. Gallup was not only convinced this prediction would be wrong, but he also successfully forecast that Literary Digest would incorrectly peg Landon’s winning percentage at 56 percent.
And thus, an industry was born.
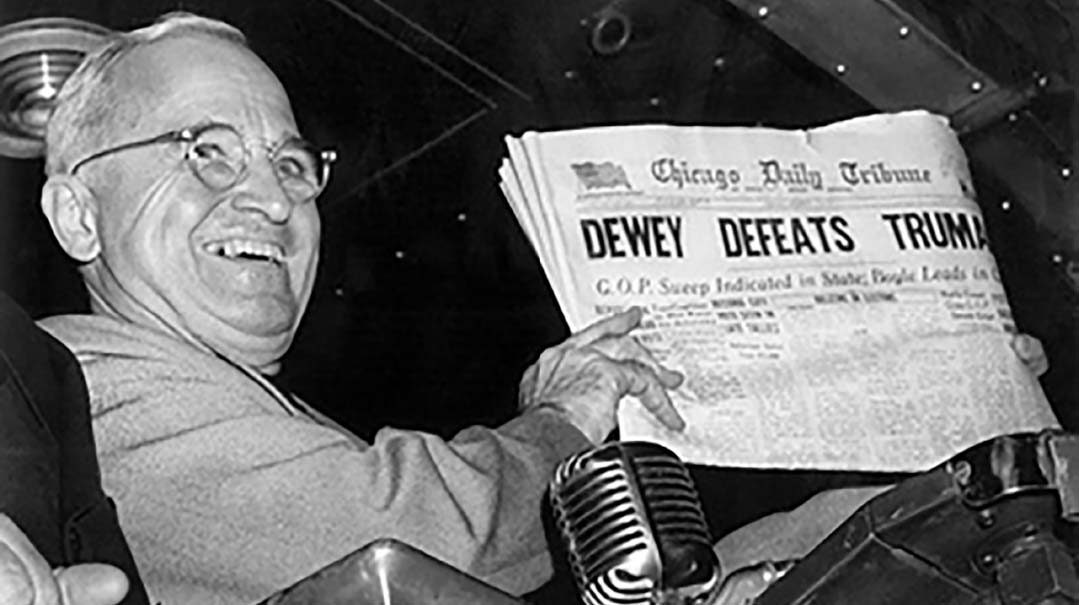
There were growing pains, of course. In the famous 1948 “Dewey Defeats Truman” election, the October polls showed Republican Thomas Dewey with a seemingly insurmountable lead over Democratic incumbent Harry S. Truman. Gallup and other firms ceased taking voter surveys; they were all caught flatfooted when Truman engineered a comeback win.
But from the 1956 presidential ballot until Barack Obama’s 2012 reelection, polling gave Americans an accurate read of how an election would turn out — for the most part. These successes meant increased demand for polling — both for campaigns (so they could decide where to deploy resources) and for news outlets. The new reality of politics was here to stay, as much a part of the process as debates and conventions.
The first crack in the system, nationally, was seen during the 2012 presidential election. Polls continually showed Obama leading Romney, and many Republicans could not fathom the idea that their man —perceived to have so much enthusiasm on his side — was being out-campaigned by a politician they had grown so tired of. And so, “unskewing” was born.
One big part of the polling process that Gallup revolutionized is figuring out what the electorate will look like come Election Day — sampling a representative population, and projecting from those results what everyone thinks. The contention in 2012 was that these samples were skewed toward Democrats, and if pollsters were only interviewing the “right number” of Republicans, Romney would be leading.
And then there was the phenomenon of the “outlier” poll. In an environment oversaturated with polls and polling companies (FiveThirtyEight.com maintains a ranking of 493 different firms, with Monmouth consistently in the top ten), it became easier and easier to find one poll that confirmed whatever bias a particular consumer might hold, no matter what other polls might be showing.
That year’s election result took care of the skewed-sample concern — and pollsters enjoyed a well-earned “I told you so” moment when the voter turnout vindicated their predictions.
To deal with the outlier issue, poll watchers adopted two innovative approaches. With one, they averaged high-quality polls to filter out “noise” from an outlier poll (a method adopted by Real Clear Politics, with its popular “rolling average”). With the other, they built mathematical models that analyzed a poll’s quality; FiveThirtyEight.com was a leader with this approach.
All was well, it seemed, in pollster land.
System Fail
The 2016 election was the first huge industry-wide failure of the system. Virtually all the polls predicted a Hillary Clinton landslide over Donald Trump — and polling expert Harry Enten even went so far as to write a piece titled “Clinton-Trump Probably Won’t Be the Next ‘Dewey Defeats Truman.’ ”
The rest, as we know, is history.
In states like Michigan, Pennsylvania, and Wisconsin, all of which Trump won, the polling was off. And in a moment of clarity right after the election, pollsters conceded they had built their models incorrectly, pinpointing college education as a factor they miscalculated. If we can just fix that, they argued, we’re back in business.
And they were… until the 2020 election.
While the 2020 result was right, the enormity of the polling failure can’t be dismissed. According to a report commissioned by the American Association for Public Opinion Research (AAPOR), the polling error was the “highest in 40 years for the national popular vote and the highest in at least 20 years for state-level estimates of the vote in presidential, senatorial, and gubernatorial contests.” The error occurred across the board, and uniformly to the benefit of Democratic candidates.
But as Murray told me, conventional wisdom held that the wild-card factor that broke polling was Donald Trump — and if he were absent from the equation, perhaps the industry could indeed be salvaged. An opportunity to test this hypothesis was the Georgia Senate runoff races. Trump was not on the ballot, and the polling turned out to be more or less accurate. Murray and the other pollsters like him could approach 2021 with confidence.
Or so they thought.
Ear to the Ground
Patrick Murray wasn’t always planning on becoming a pollster. His first foray into the world of polling was as a college student, taking a part-time job as an interviewer for a firm in Washington, D.C. His career goal at that point was a post in academia, and he entered graduate school in political science. But he soon realized that the part of that field that interested him most was researching and understanding the ways people thought and behaved. His experience as a student interviewer was formative in that regard.
“Understanding how that interaction works, between the interviewer and the person who’s responding on the other end, was incredibly invaluable to me later on,” he tells Mishpacha.
To conduct a legitimate survey, Murray learned that building a representative sample and utilizing a viable mathematical model were essential ingredients. But he also soon realized that the way the pollster asks the questions is equally important.
“If you ask a question that an academic or political pundit wrote, to get reaction to the way they see the world, you can get answers to those questions,” he says. “But that might not be how people on the ground actually think about these things.”
That’s where another, less well-known part of polling research comes into play: qualitative research. After spending some time at the Eagleton Institute of Politics’ polling outfit, he was recruited to start up Monmouth’s polling institute — where he has been approaching polling his own way for the past 16 years.
Murphy uses a somewhat unconventional approach to form his questions, and this helped slingshot him to the top of his field. “I used to eavesdrop in diners to hear what people were talking about. And sometimes I thought, ‘The way this person just said that is exactly how we should be asking that question about this topic.’ ”
But even that simple stratagem has become more complicated these days.
“The filters people use to answer questions now, based on their partisan tribal affiliation, has become such a hard wall to break through,” Murray laments.
He says that particularly in the last five years, answers to simple, standard questions — How is your family doing economically? Are you struggling right now? Are you getting ahead? — are drawing responses clearly aimed at gaming the system. (Gallup called this phenomenon the “prestige answer,” or what the respondent thinks he or she is supposed to answer.)
“These are questions for which the answers should be entirely disconnected from politics — and it did used to be that way,” he says. But now, more and more people are answering even those questions “in ways that would make whoever was in power look good or look bad, depending on whether they were aligned with him politically.”
Pollster’s Craft
The truth is, though, that the impact the questioner can have on a poll’s result is not really something new. And when I challenge him on it, he has two examples that come immediately to mind. The first is a famous poll he’s been citing in his lectures for nearly 20 years, related to the Augusta National Golf Club in Georgia.
In 2002 the golf club was set to host the annual Masters golf tournament, but suddenly found itself under attack from national women’s groups for its exclusionary membership policies. Worried about the financial and public relations impacts of a boycott, the club commissioned a poll to gauge public concern over the issue.
“Their poll suggested that by two-to-one margin, Americans were okay with their membership policy as it was, because they were a private institution and they didn’t get federal funding,” Murray says.
But when outside experts began analyzing the questionnaire, they noticed some interesting things. For example, the question about Augusta National’s membership policies was way down the list, with a whole bunch of questions preceding it.
“The first question in the poll was”—Murray pauses a beat for emphasis—“I’m not kidding you. Verbatim, it was, ‘I am going to read you the First Amendment to the Constitution.’ The surveyor then read the First Amendment of the Constitution and then basically asked, ‘Do you agree or disagree with the First Amendment?’
“Then it went on to ask about the Boy Scouts, Girl Scouts, the NAACP, all these things — should they be allowed to have certain membership policies? So by the time you got to the question about Augusta, if you were against Augusta doing what it wanted, you were against Mom and apple pie.”
Interestingly enough, that poll was conducted by none other Kellyanne Conway, President Trump’s 2016 campaign manager — the first recent race many pollsters got wrong — and led to the first round of introspection on this issue.
The other example Murray cites is from 2008, when New Jersey’s 84-year-old Senator Frank Lautenberg ran for reelection. Both Monmouth and Quinnipiac surveyed voters on Lautenberg’s age, with wildly variant results. Quinnipiac found a majority saying he was too old, while Murray’s poll found that fewer than a third felt that way.
The difference, again, was in how the question was asked.
“Quinnipiac’s poll told all the respondents that Lautenberg was 84 years old,” Murray says. “Mine did not. Mine just simply asked, ‘Do you think Frank Lautenberg is too old?’ ”
In the end, Lautenberg won in a landslide, indicating that Monmouth, not Quinnipiac, had better assessed voter concerns about the senator’s age.
What is important to understand, he says, is that while Quinnipiac’s question might seem factually correct as asked, it wasn’t really going to produce an accurate result. Because, he explains, it would only produce an accurate result if “100 percent of all voters knew how old Frank Lautenberg was.”
And this, he says, gives insight into the pollster’s craft, in terms of understanding voter behavior: “You don’t vote on the actual facts. You vote on what you think the facts are.”
Predicting Turnout
After a decade of Monmouth working with government agencies on research, and doing extensive New Jersey polling, Murray realized that his approach could be an asset to the conversation if it were expanded to the national arena. In 2015, he began doing polling around the country, first traveling to the states he would be sampling to get a sense of what animated voters there.
Mastering that art is hard enough in New Jersey, and even more so nationally — and it’s part of what helped Monmouth stand out. These days, because of the self-imposed tribalist filters Murray mentioned, asking the right sort of questions is even harder — possibly because what used to be accepted as basic facts have become subjectivized and dependent on political identity.
But another part of the pollster’s job has also gotten harder. Collecting a sample of responses that is representative of the population is an essential part of any survey. But a poll trying to predict the outcome of an election also needs to incorporate some kind of methodology that accounts for the likelihood of voter turnout in different sectors of the public.
And that model is getting harder and harder to build as the political landscape gets more complex. The little-known secret about that part of the polling formula is that, as another political professional told me in a private conversation, there is “a lot of judgment” and it’s not really based on any sort of objective facts.
“There’s no science that says exactly how you determine who’s going to show up to vote,” Murray says. “Everybody takes guesses as to which factors are most important. Every pollster does it differently.”
So, pollsters will use things like voter files from previous elections, donation records, and the like, to try to build a model for who will come out to vote in the election. Unlike an issues-based public opinion poll, which just needs to extract a sample representative of the country’s known demographics, an election poll involves guesswork.
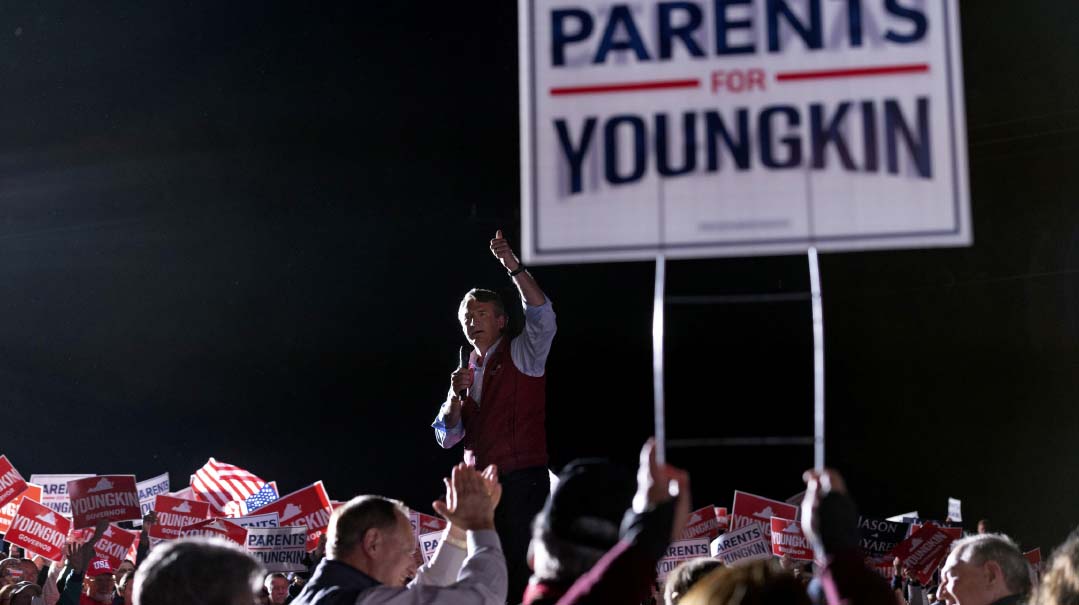
And in the recent New Jersey gubernatorial election, almost every pollster got it wrong. But what perplexed Murray most — leading him to question whether he or anyone could continue polling in good conscience, in such a volatile political environment — is that the very same model that failed so spectacularly in the New Jersey contest accurately predicted the Virginia governor’s race — in which Republican upstart Glenn Youngkin surged late to beat heavily favored former governor Terry McAuliffe.
And as if to underscore this point about volatility, the one pollster who did come close, the Trafalgar Group, was the one pollster who missed badly on the Senate runoffs earlier this year — and he is based in Georgia.
Jersey Joker
This disparity between the New Jersey and Virginia results is partly due to the rise of a new type of “low-intensity” voter, Murray explains.
Looking at the New Jersey poll, he points out, he really only got the election half-wrong. Murray’s final poll had Murphy at 51 percent — remarkably close to the governor’s actual share of the vote. But Murray had Ciattarelli only garnering 40 percent of the vote —underestimating his share by seven points.
That sort of big miss leads Murray (and his view is echoed by other polling and political professionals) to believe that the problem lies primarily in how these polls capture the voices of a new kind of Republican voter — but in specific kinds of races.
“In Virginia, we captured them,” he says. “And that might have been because that was such a high-profile race. People were engaged on both sides in ways that whatever errors that we had in the polling just canceled themselves out. Whereas in New Jersey, because it was a lower profile race, it was thought to already be in the bag for the Democrat, so that the error we had there was only reflected on one side.”
What makes these new Republican voters hard to capture is that they “participate in the system in only certain ways,” Murray says. “They come out and they vote. They come out and they might protest. But they don’t engage in other forms of political discourse.”
And that makes it much harder to build an accurate turnout model in a low-engagement race; the traditional indicators for whether these voters will actually come out to vote are lacking. In Virginia, where the race was in the news every day, and the school board issues animated voters to the extreme, he was able to capture these voters in his sample. But in New Jersey, where they did not participate in any of the other political activities that make them measurable, because of how low-key the race was, those voters came out nevertheless.
Partisan Identity
So who are these voters, exactly? The challenge for Murray and other pollsters is that there’s no clear way to quantify them.
“We don’t have a good way to measure them,” he says. “It’s kind of like a working classification, like where do you fit in the world in terms of your class — but it’s not upper class, lower class, middle class. It has to do with what type of job you have, combined with what kind of education you have, combined with where you live — what type of community you live in.”
That mix of factors seems to offer a promising lead, Murray says. But so far, the efforts to follow through on it have not led to the kind of granular detail that pollsters value.
“We don’t have questions that we can ask to individually identify these voters, but can we in the aggregate figure out where they’re coming from and make adjustments based on geography as well as partisan identity?” he elaborates, trying to describe the challenge these voters pose to pollsters. “You run into that kind of ecological fallacy. Now what you’re doing is, even though you’re in the right place, and looking for the right people, you’re replacing them with the wrong people who live near those people. So you’re replacing the ones who are going to vote Republican with people who fit that profile and are actually going to vote Democrat.”
And that, he says, makes it nearly impossible to poll with any real degree of confidence.
Greater Good
Patrick Murray’s decision to step back from election polling comes down to the bluntness of the tools in the pollster’s kit — but not only that. The media’s relentless focus on polls at the expense of deeper political reporting has played a part in persuading him to hang up his clipboard.
“I asked the staff to go back and do some content analysis of poll reporting, and we consistently turned up that even though we ask 15 questions in a poll, which includes candidates’ opinions, top issues, and all sorts of other things, the vast majority of the media reports are just the horse-race number,” Murray says.
“Quite frankly, it’s lazy reporting,” he charges. “Fewer reporters are now assigned to cover campaigns, so you don’t get those in-depth stories about what a candidate’s policy plank is and how the folks in the diner are reacting to the policy plank. You get, ‘Here, we got a piece of data, that’s the easiest to hang our hat on. Let’s just report this and then talk about momentum.’ ”
That single-minded focus on the horse race colors all the rest of the campaign coverage, Murray says.
“Every time a candidate has a press stop, what do they ask them about?” he asks rhetorically. “Do they ask him about the policy planks? No. They ask him about the latest poll and where he thinks he stands based on that.”
It’s not hard to see what Murray means. In 2016, for example, most of the questions that candidates in the Republican primary not named Donald Trump got asked were about the insults he had lobbed their way.
As the one producing the horse-race figures, Murray says he has done some introspection.
“That’s the media’s fault, but I’m giving the media fodder to be able to do that,” he concedes. “That’s where I have to think about what my responsibility is. Now, one person can’t turn off that spigot entirely. But I can only do what I feel I have to do.”
Monmouth bowing out of the polling game will certainly have an impact, though it’s too early to tell how many other pollsters — if any — will follow suit.
If nothing else, a public statement from as respected a pollster as Patrick Murray ought to prompt some introspection on the part of both the industry and the media, who are the direct consumers of polling.
Whether or not that happens, Murray has decided to move on, because he thinks America’s polling addiction is adding fuel to the partisan bonfire.
“With the direction our country is going right now — and the political divide is very dangerous — I can’t stick my head in the sand and just keep saying, ‘Well, everybody else is doing it, and I’m still a pretty good pollster.’ I’m looking at a situation where, can I go to sleep at night?”
(Originally featured in Mishpacha, Issue 889)
Oops! We could not locate your form.

