What’s Trump’s Magic Number?

A lot of folks didn’t see Trump’s victory coming in 2016. Fewer people see where it might come from on November 3

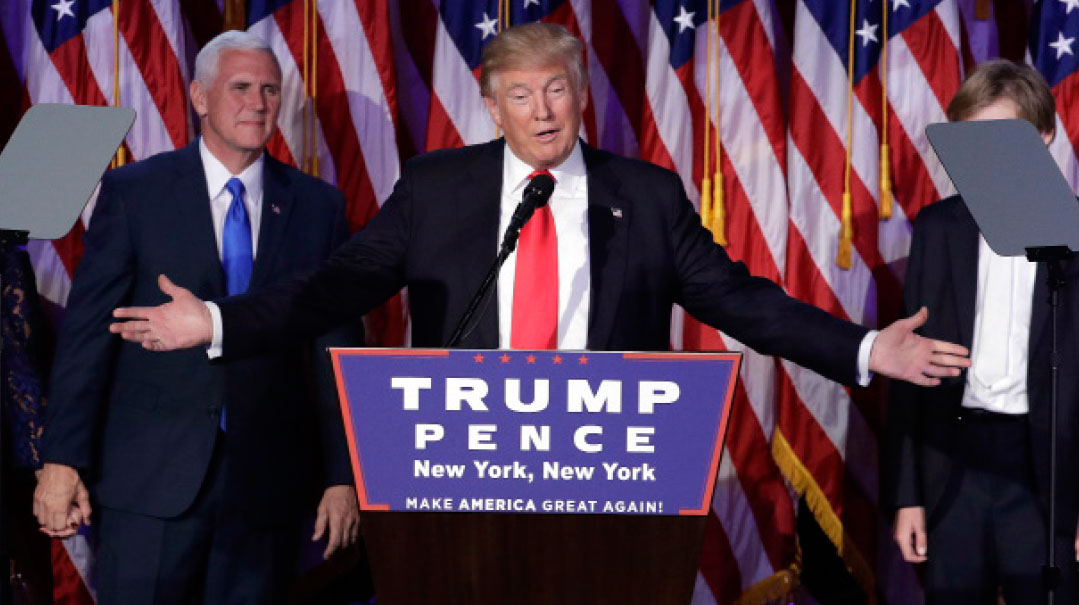
Two days before the 2016 presidential election, our editorial team was finalizing coverage plans for election night. One issue we pondered was how much of our resources to commit to Trump’s campaign headquarters, considering his dire position in the polls.
Back then, in my capacity as news editor, I drew a deep breath, took one last, long look at the polls, and recommended we go all in on Trump, because his numbers were within the margin of error in every state he needed to win.
It turned out to be the right call. Trump confounded the pollsters in several key states, where he reversed the normal 3% to 5% margin of error in his favor, winning enough electoral votes to defeat Hillary Clinton.
Can Trump do it again? With three weeks to go before the 2020 election, Trump trails his Democratic challenger Joe Biden by almost 10 points nationally. More importantly, Trump lags Biden by more than the margin of error in seven of ten states classified as “battlegrounds” in the Real Clear Politics Average (RCP) poll, a composite of more than a dozen national polls.
It would be facile to dismiss these polls as “fake news” or “biased.” The same polls in 2016 showed Hillary leading Trump by 3% two days before the election. She won by 2%. You can’t get much closer than that. The mistake pollsters made was more in how they interpreted their numbers, especially in Pennsylvania and Michigan, which Trump flipped to the Republicans.
Pollsters have since adjusted their surveys to compensate for past mistakes and to adapt to changing conditions that prevail in every general election. We won’t know how the polls fared until all the ballots are counted, however long that may take with all of the mail-in and absentee balloting.
Suffice it to say that a lot of folks didn’t see Trump’s victory coming in 2016. Fewer people see where it might come from on November 3, especially with Biden having held a consistent lead throughout the race.
Sean Trende, RCP’s senior elections analyst, suggests keeping a close eye on Trump’s job approval rating, contending that is an excellent predictive tool to see how he will fare on Election Day. In winning their reelection campaigns in 2004 and 2012, both George W. Bush and Barack Obama finished with percentages that came within 1% of their job approval ratings.
In 2016, Trump captured 46% of the popular vote. Trende feels confident that 46% is Trump’s magic number this time around as well, assuming that enough of that comes from key battleground states. At press time, Trump’s RCP average approval rating was 44.5%. According to Nate Silver’s FiveThirtyEight blog, which features charts of presidential approval ratings dating back to the Truman presidency in the 1950s, Trump’s peak approval rating has never topped 45.8%.
This is a warning sign for Trump with three weeks left in the race. However, if you slide your cursor carefully along Silver’s charts, as I did, you’ll find that Bush boosted his approval rating by more than 2% in the three weeks prior to his razor-thin 2004 reelection. Even Obama inched his up nearly 1% in the final stretch.
Trump will need every bit of that type of last-minute surge if he expects to serve another four years.
(Originally featured in Mishpacha, Issue 831)
Oops! We could not locate your form.


